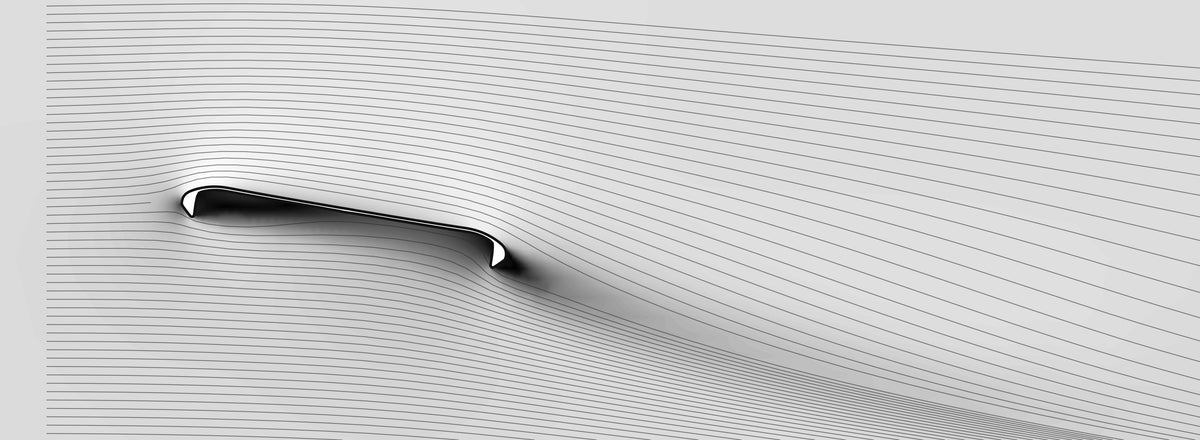
Article: Research: Case study on the Discmania Q-Line technology.
Research: Case study on the Discmania Q-Line technology.
Abstract: Recently, the gyroscopic effect in disc golf has been a major interest and a source of debate. Some players swear by it, claiming longer and straighter flights. Manufacturers advertise bold claims, all while some players refute the technology fully.
The "gyroscopic effect" in this context means putting more weight on the edge of the disc. "More" in this context meaning more than a comparative disc. The extra weight on the outside increases the inertia of the disc and hence theoretically increases spin retention and makes the disc fly straighter and further.
This is a case study focusing primarily on the Discmania Q-Line discs, mainly the Premier DD1. By laser-scanning the disc we have measured its shape and weight distribution and can accurately model it in the simulation. The simulated environment allows us to objectively compare the disc to others and artificially alter the physical properties like inertia and spin retention to isolate their effect on the resulting flight path.
The Q-Line discs are confirmed to have a significantly thinner flight plate and higher inertia per gram. The Q-Line DD1 had a 40% thinner flight plate and 5% more inertia per gram than comparative discs.
The key findings are that the extra inertia does help with making the disc resist turning. The claimed higher spin retention is found to have no significant effect and no conclusive support is found for the added gyroscopic effect to increase the potential distance. The Q-Line DD1 is found to be a good mould and has some of the best driver properties out of all the discs we have scanned. Therefore, it is likely that the Q-Line DD1 itself can fly meaningfully further than other "normal" discs, but the effect cannot be attributed to the extra gyroscopic effect.
Motivation: In the debate around the gyroscopic effect, there are many opinions and empirical tests, but little research and objective data. A simulator is a great place to test these theories as we can throw the same disc thousands of times identically and change exactly one property at a time. This is an independent study not endorsed by Discmania or any other party.
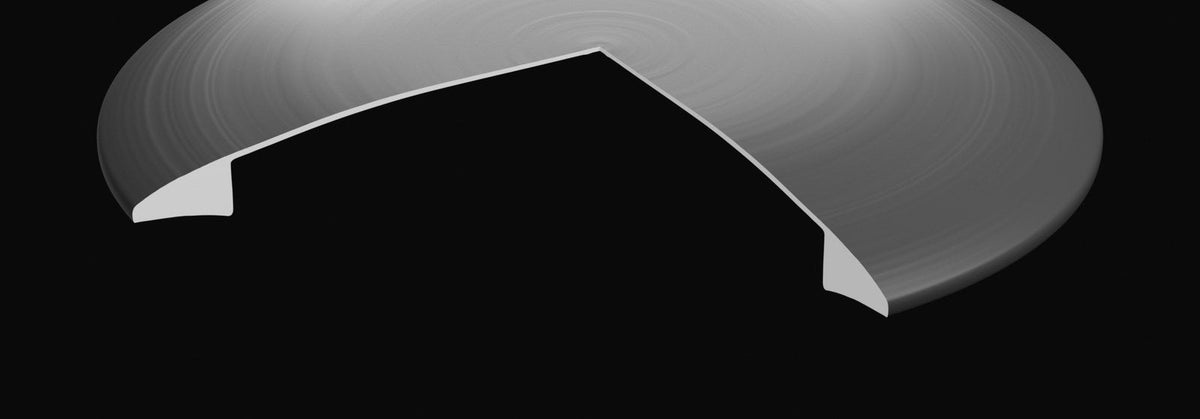
 The laser-scanned Q-Line DD1.
1. THE KEY CLAIMS.
In the Q-Line plastic, the extra gyroscopic effect is achieved by having a thinner flight plate so that more of the mass sits in the rim. Three claims come from this:
- More weight in the rim. The thinner flight plate means that the rim has a bigger share of the plastic.
-
Better spin retention. The recently published Discmania video shows measurements of the Q-Line discs losing spin slower than standard discs.
-
Straighter flight and more distance. This is the key promise of the technology to allow for straighter flights and longer throws.
2. WHY THE WEIGHT DISTRIBUTION MATTERS.
A disc golf disc is a spinning gyroscope. The air pushes on the disc with a pitching moment that tries to tip the disc's nose up or down. Due to the gyroscopic precession, the air does not tip the nose of the disc, but rather the disc rolls sideways. This is the mechanism behind the turn and fade. For a disc spinning in the air, a good approximation of the roll rate is:
roll rate ≈ pitching moment / (spin inertia * spin rate)
This is present in published flight models, for example in Hummel (2003) and Crowther and Potts (2007). It says that a disc with more inertia, or more spin, tilts more slowly. In our own simulations this roll rate law is followed closely.
For the flight of the disc, this means that a rim-weighted disc should hold its lines better, which is often desirable in disc golf.
3. METHOD.
The disc. A new Discmania Q-Line DD1, 172.9 g, laser-scanned in full. All tests in this study use this physical disc as we have scanned it. From the scan we measure the diameter, height, rim width and flight plate thickness. The flight plate thickness is the median thickness over the inner 40 mm.
It should be noted that there are differences between discs, even when they are the same mould, plastic and weight. This disc is scanned and analysed as we have it.
 Figure 1: Half cross-section of the scanned Q-Line DD1, true scale: 210.8 mm across, 18.4 mm tall, a 0.99 mm flight plate and a 21.2 mm rim.
Mass properties. The spin inertia and the tumbling inertia come from the scanned shape and the measured mass. A key assumption is that the density of the plastic is uniform.
Aerodynamics. The lift, drag and pitching moment come from a computational fluid dynamics (CFD) process. This can be thought of as a virtual wind tunnel in which we can analyse the aerodynamics of the disc and get the data needed for the accurate simulation.
Flight model. The simulations use the HYZR flight model that is used in the simulators. The exact form is proprietary, but as an independent check, the published open-source flight model Shotshaper (Giljarhus et al. 2022) reproduces our Q-Line differences to within about a metre.
One change at a time. In the simulator, we can take the same scanned DD1 and artificially change one property at a time and observe its effects on the result.
- Spin retention: the Q-Line spin loss rate swapped for the standard plastic rate from Discmania's own chart. Same disc, same inertia, same shape.
- Inertia: the DD1's spin inertia set to that of a typical driver, the median per gram of the distance drivers (speed 11–13) we have scanned. Throughout this article this version is called "the same DD1 with typical inertia" which means that the Q-Line DD1 is simulated with smaller inertia than it actually has.
- Shape: Our own addition to study the shape to see if the thickness of the flight plate itself causes changes in the flight. We simulated discs with artificially thinner and thicker flight plates to study the effect of the change in the shape.
Throws. Right-hand backhand throws from 70 to 120 km/h (19–33 m/s), with a typical spin for each arm speed, plus forehands with measured forehand spin levels.
Two kinds of comparison are used. "Same throw" means both versions get an identical release, which shows what the property does to a given throw. "Own best release" means each version is optimized the way that gives it its longest flight that lands near the target line, which simulates a player throwing a max distance throw that still lands in the fairway. All throws are clean releases without wobble, to keep the comparisons as even as possible.
4. THE FLIGHT PLATE IS THINNER.
The scan confirms that the flight plate is meaningfully thinner than standard discs. The DD1's flight plate was measured at 0.99 mm thick. Three standard plastic drivers with flight numbers within one step of the DD1's measure 1.53 to 1.89 mm, so the DD1's plate is about 40 % thinner than their average. It is the thinnest plate of any driver we have scanned. Our second Q-Line disc, a DD3, shows the same thing against standard DD3s of the same mould: 1.15 mm against 1.47 and 1.52 mm, about 22 % thinner.
 Figure 2: The flight plates, zoomed in at true aspect and aligned at the top surface. a) The Q-Line DD1 against three drivers with similar flight numbers. b) The Q-Line DD3 against a new Neo DD3 and an S-Line DD3.
5. MORE OF THE WEIGHT SITS IN THE RIM.
The plastic saved in the flight plate ends up in the rim: 80 % of the DD1's plastic sits in the rim, against 70–75 % for the comparative drivers. The DD1 has 5 % more spin inertia per gram than a typical driver and 4–6 % more than the three comparative drivers. That is the highest per gram of any driver we have scanned.
 Figure 3: The share of the plastic inside each radius. The DD1 (red) keeps less of its plastic in the flight plate and more in the rim and is a clear outlier. Even plastic density assumed.
6. SPIN RETENTION: DOES IT MATTER?
A disc loses its spin because of air friction on its surface. The rate at which it loses spin is that friction torque divided by its spin inertia, so a rim-weighted disc should, all else equal, keep its spin a little better. The theory supports this, and in this study we use Discmania's chart from their recent YouTube video that shows exactly that for the DD1.
We flew the chart's two spin loss rates on the scanned DD1, read as generously as possible: the loss rate at the release speed held for the whole flight. On a 110 km/h drive the Q-Line disc lands with 953 rpm left against 929 rpm, having lost 24 % of its spin instead of 26 %.
The key thing about the spin retention differences lies in the fact that the difference in spin decay is small throughout the flight. Even during longer throws, the difference in lost spin is relatively insignificant, and retaining a bit more spin does not significantly change the flight path. In our simulations, the two throws with Q-Line spin retention and "normal" spin retention are 18 cm apart, which is too close to be considered a measurable effect.
For scale we also flew two exaggerated extremes: no spin loss at all, and three times the standard rate. Those extremes land 6 m apart which does mean that the spin loss itself matters, but the claimed difference due to the plastics does not.
 Figure 4: a) Spin during a 110 km/h drive with Q-Line spin loss, standard spin loss and two exaggerated extremes. b) The same drives from above: the Q-Line and standard lines land 18 cm apart.
The key takeaway from this is that we found no proof that the higher spin retention would meaningfully improve the flight path. The main reason being that the difference in spin loss between the plastics is small to begin with, making the difference in the realized spin too small to change the flight meaningfully.
7. THE HIGHER INERTIA CHANGES THE FLIGHT.
Even with the same spin, the rim-weighted disc has more inertia, which affects the flight. On the same hard throw at 110 km/h, the same DD1 with typical inertia turns over and lands 11.7 m right of the line while the real DD1, with its rim weight, lands 4.5 m right: 7.3 m less turn.
On a slower 70 km/h arm the two flights lie on top of each other (0.1 m apart). The effect is larger on longer throws.
 Figure 5: a) A 110 km/h drive from above, the same release for both. b) The same at 70 km/h. c) The bank angle along the 110 km/h throw: the DD1 rolls over less and ends the flight with more hyzer.
Distance. When each version is thrown its own best way, the rim weight adds +0.3 to +0.4 m of distance at every arm speed from 70 to 110 km/h. This means that in the simulator, with each disc thrown its own best way, the extra inertia does not make the disc fly meaningfully further. The gyroscopic effect changes where the disc lands much more than how far it goes. The resulting flight might be more desirable and maybe easier to throw far within the intended direction, but we found no conclusive support that the inertia itself would make the disc fly considerably further in absolute distance.
8. FOREHANDS: LESS SPIN, BIGGER EFFECT.
Forehands generally have much less spin than backhands. Measured release data from 28 players (Turner et al. 2024) shows a forehand carrying roughly 59 % of the backhand's spin at the same speed. Our own data from the HYZR simulators gives similar numbers. Since the roll rate scales with one over the spin, the same extra inertia should matter more on a forehand. We flew four spin levels at 100 km/h, each at the DD1's own best release, as a right-hand backhand or forehand:
| throw | spin | turns less | lands closer to the line | extra distance, own best release |
|---|---|---|---|---|
| high-spin backhand | 1500 rpm | 2.0 m | 3.5 m | +0.4 m |
| typical backhand | 1250 rpm | 2.4 m | 4.3 m | +0.3 m |
| high-spin forehand | 890 rpm | 3.6 m | 5.8 m | +0.3 m |
| typical forehand | 740 rpm | 5.3 m | 7.6 m | +0.4 m |
The saved turn grows almost exactly as one over the spin. On a typical forehand, the same DD1 with typical inertia turns 12 m left and barely comes back; the real DD1 turns 7 m and fades back to about 5 m from the line. Distance is again unchanged.
 Figure 6: a) A typical backhand and b) a typical forehand at 100 km/h, seen from above. c) The effect at each spin level: the turn the rim weight saves grows as the spin drops, while the distance gain stays at +0.3 to +0.4 m.
9. WIND: IT RESISTS TURNING OVER.
Thus far, all simulations have been in perfect conditions, which only exist in a simulator. In real life the wind has a major effect on the flights.
A headwind increases the airspeed over the disc and makes every disc turn more. On a throw that already S-curves in an 11 km/h (3 m/s) headwind, the DD1 turns over less and fades out a little sooner. At 100 km/h it turns 3.5 m instead of 7.5 m and lands 2.8 m left of the line instead of 5.2 m right. On a throw tuned for calm air that turns over completely in the wind, the DD1 holds on noticeably better and lands about 6 m further. When each disc is aimed its own best way into the wind, the difference is only +0.3 m.
 Figure 7: The real DD1's longest gentle S-curve into an 11 km/h headwind at a) 100 km/h and b) 90 km/h, with the same DD1 at typical inertia thrown identically.
Here, the wind was simulated in a very simple way with constant wind, while in real life wind can be more chaotic and have different effects on the flights. Generally speaking, the rim weight has a slightly larger effect in the wind due to its higher inertia.
10. MAYBE IT HELPS WITH REAL-WORLD THROWS?
Real throws are never identical. One possibility for the additional distance claim is that the Q-Line would be more forgiving of small errors in the release and hence allow players to, on average, throw further with it. In real life, a player would aim for their optimal distance line, but naturally not throw it perfectly. We tried simulating this by taking the optimal throw for the disc and then adding small randomness to the release.
We simulated the DD1 as scanned and the same DD1 with typical inertia 400 times each, with identical random errors in arm speed, spin, hyzer, nose and launch angle, around each version's own best release.
We did this for three kinds of player: an amateur set at 70–90 km/h with twice the everyday randomness and the nose aimed 2–4° up (most amateurs throw nose up), everyday throws at 100 km/h, and an advanced set at 110 and 120 km/h.
| player | extra average distance | landing within 10 m of the line |
|---|---|---|
| amateur, 70–90 km/h | 0 to +0.8 m (ahead in all 6 sets) | about the same |
| everyday, 100 km/h | +0.4 m | 47.0 % vs 44.8 % |
| advanced, 110 km/h | +0.3 m | 37.3 % vs 32.5 % |
| advanced, 120 km/h | +0.5 m | 30.5 % vs 27.0 % |
The rim-weighted DD1 is ahead in every set, but only by under a metre. Strong arms also keep a few more throws near the line, which fits the stability results: the harder the throw, the more the extra inertia has to resist. The landing clouds themselves look almost identical.
 Figure 8: Landing spots of 400 random throws at 100 km/h, seen from above at true scale; + marks the average landing. a) The same DD1 with typical inertia. b) The Q-Line DD1 as scanned.
There is a very small edge in distance and accuracy. The difference is too small to say confidently that based on this the rim-weighted disc would be better.
11. DOES THE SHAPE ITSELF EXPLAIN THE DIFFERENCE? HARD TO SAY.
This is our own addition to the discussion: the shape. From the 3D scans, we know that even small changes in the shape can affect the flight considerably and hence one of our research questions was if the shape difference in the flight plate thickness itself affects the flight.
To test this we took the scanned discs and made their flight plate artificially thinner (for normal discs) and thicker (for Q-Line) while keeping everything else the same.
Making the plates of five standard drivers 0.35–0.45 mm thinner moved their landings by 3 to 7 m. For reference, our control runs of unchanged discs show a typical simulation noise of about ±1.8 m. This is due to the inherent noise and randomness in the complex CFD process.
Small shape details matter a lot, and CFD has its own randomness that cannot reliably resolve the smallest changes. A real thinner plate also probably changes other details of the shape in manufacturing, which makes it hard to separate the shape from the weight distribution. These artificially tuned discs might not properly account for the manufacturing process needed to create the thinner flight plate and hence are not a totally fair comparison.
 Figure 9: a) Destroyer #2 with its plate 0.35 mm thinner, same throw at 110 km/h. b) Every plate change we simulated, with the typical size of the simulation's own noise shaded.
From the figure above, we can see that generally the discs with a thinner flight plate were more overstable. The results are too noisy to say anything conclusively. If the thinner flight plate makes a disc more overstable, the mould could otherwise be made more understable, which generally has better properties for longer flights.
12. DOES THE Q-LINE FLY FURTHER?
If the spin retention and inertia don't add meaningful distance, where does the Q-Line DD1's reputation come from?
We offer one explanation that we can confirm with our data: The Q-Line DD1 is a really good mould.
With each disc thrown its own best way, the Q-Line DD1 is the longest of all the distance drivers we have scanned at 70 km/h, and joint second at 110 km/h. It has the second-most lift of those drivers at normal flying angles (2–4° angle of attack) and the third-highest trim angle, so it keeps generating lift and carries at low speed.
Essentially in our simulations, the Q-Line DD1 is an outlier disc due to its good shape and flight characteristics.
 Figure 10: The ten longest distance drivers we have scanned at a) 70 km/h and b) 110 km/h, each thrown its own best way, at its own weight and in its own condition.
Our other Q-Line disc, a DD3, sits mid-pack. At 168.6 g it is lighter than the others, though, so it may not be representative. The evidence points to the DD1 mould rather than the Q-Line construction as the source of its distance.
13. RESULTS.
- Q-Line keeps its spin longer: physically sound, but no significant effect found. More weight in the rim slows spin loss, and Discmania's own tests show a small gain, but it does not move the landing meaningfully in our tests. Even with a generous reading of the measured difference, the effect remains minimal.
- Thinner flight plate, more weight in the rim: confirmed and measured. The Q-Line discs have a significantly thinner flight plate than other drivers with similar flight numbers. They have more spin inertia per gram than a typical driver.
- The higher inertia changes the flight: yes, on hard throws. It resists turning over and flies a bit straighter. The effect is slightly larger in wind and low spin throws. The flight is not significantly longer in absolute distance due to the increased inertia in our tests. Arguably, the distance could be slightly more with real world variance and when measured to the intended direction, though the effect is small.
- The Q-Line DD1 flies further: probably yes. It is one of the longest drivers we have scanned, with high lift at normal flying angles, a high trim angle and the most spin inertia per gram. In our simulations most of the perceived distance effect is attributed to the shape.
14. WEAKNESSES.
- Two Q-Line discs, one copy each. Two Q-Line discs were scanned as we have them. There are differences between discs that can significantly change the results.
- Weight distribution. The inertia is computed from the scanned shape with even plastic density. If the rim plastic is denser than the flight plate plastic, the effect is larger.
- A rigid disc. The simulation treats every disc as a rigid body. The throws were chosen with zero wobble to minimize the uncertainty around this, but in real life throws with wobble, the weight distribution could affect the rigidness of the disc especially during the early parts of the flight. This requires further research.
- No wobble. Every throw is a clean release without wobble, to keep the comparisons as even as possible.
- Simple wind. Most throws fly in calm air, and wind was tested only as a steady head- or tailwind. Gusts and crosswinds were not.
- Discs change. Plastic wears in and differs between production runs. Our scans show each disc as it is today.
- The airflow simulation. CFD results depend on modelling choices and carry their own noise; very small shape effects (section 11) are near the limit of what it can resolve.
- Real life is messier. The simulator gives every throw perfect, repeatable conditions. Real throws, wind and discs will never match that randomness exactly.
REFERENCES.
- Crowther, W. J. and Potts, J. R. (2007). Simulation of a spin-stabilised sports disc. Sports Engineering 10, 3–21.
- Discmania. Why Discmania Premier Technology Works | Tested by TechDisc. Video, Discmania Discs YouTube channel (youtube.com/watch?v=VQatMNYHS2E).
- Giljarhus, K. E. T., Gooding, M. T. and Njærheim, J. (2022). Disc golf trajectory modelling combining computational fluid dynamics and rigid body dynamics. Sports Engineering 25, 26. doi:10.1007/s12283-022-00390-5.
- Hummel, S. A. (2003). Frisbee Flight Simulation and Throw Biomechanics. M.S. thesis, University of California, Davis.
- Kamaruddin, N. M., Potts, J. R. and Crowther, W. J. (2018). Aerodynamic performance of flying discs. Aircraft Engineering and Aerospace Technology 90(2), 390–397.
- Potts, J. R. (2005). Disc-wing Aerodynamics. PhD thesis, University of Manchester.
- Turner, A., Caldwell, A., Webster, K., Dickerson, C. and McPhee, J. (2024). Launch speed and spin versus player skill level for disc golf throws. The Engineering of Sport 15 (ISEA 2024).